• 4 min read
A developer built watchable digital twins of World Cup games
A developer turns 2022 World Cup tracking data into watchable 2D and 3D digital twins, including a recreation of the final on Mars.
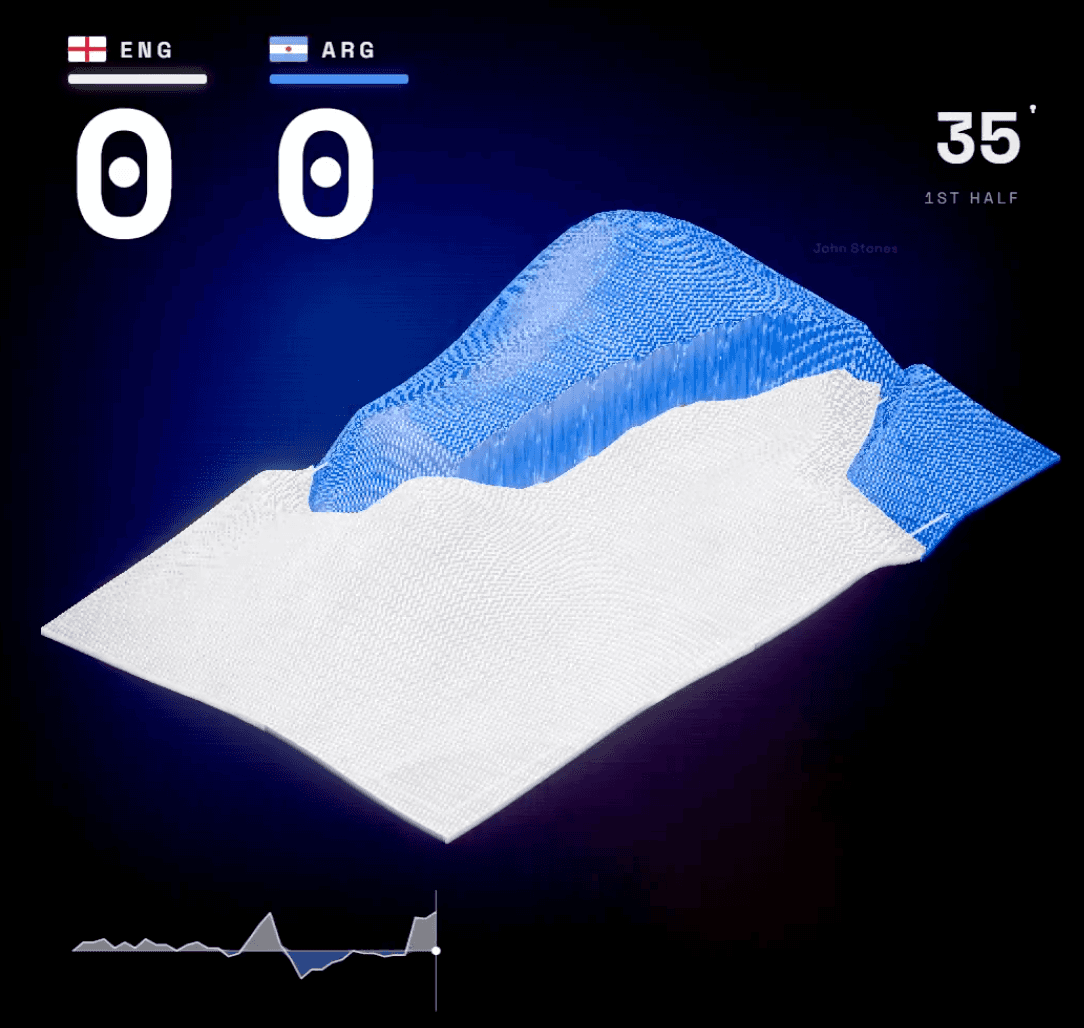
Image: here
A typical sports broadcast can be transformed into a detailed, machine-readable model of a soccer match. That is the foundation of Roger Dickey’s project to build watchable digital twins of all 64 games from the 2022 World Cup.
The project began after Dickey saw World Cup visualizations shared on social media, including one by Alexander Bogachev.
Commercial sports-data providers generate this information from live broadcasts using a combination of computer vision and human annotation. The broad process includes:
- Object detection and OCR for player and ball tracking
- Field-geometry identification to transform broadcast coordinates using penalty-box corners, the center circle, and goal lines
- Inference and human tagging for passes, interceptions, shots, penalties, and other events
Player tracking becomes more complex when a jersey number is not visible. Providers use visual embeddings to maintain their best estimate of a player’s location. The completeness of the resulting data varies considerably.
Recommended reading
WhatsApp adds iPad accounts and PDF edits
Comparing soccer data providers
Dickey found five providers offering free data samples for developers:
| Provider | Games | Available data | Frames per game | |---|---:|---|---:| | PFF | 64 | Videos, events, tracking | ~160,000 | | StatsBomb | 426 | Events, tracking | ~3,000–4,000 | | Metrica | 3 | Events, tracking | ~160,000 | | SoccerNet | 550 | Videos, raw computer-vision data | ~160,000 | | WhoScored | Many | Average team X position | ~100 |
The underlying records can include matches, rosters, events, and tracking frames. Match data may contain the competition, date, teams, stadium, score, outcome, and number of periods. Roster data covers each player’s name, team, position, jersey number, and whether they started. Events include the type, timestamp, duration, actor, and event-specific details. Tracking data records each player’s XY position and the ball’s XYZ position for every frame.
For a high-resolution digital twin, Dickey needed at least two frames per second, or roughly 11,000 frames per match. PFF’s data was the best fit: it provides XY coordinates for every player at 30Hz, enough resolution for detailed analysis and visualization. It also covers the 2022 World Cup, while some other sources focus on regional leagues. Dickey adds that SoccerNet appears to have the strongest scientific community around game-data extraction, with multiple publications and public repositories.
PFF’s per-match data footprint is substantial:
- Match: 1KB
- Roster: 8KB
- Events: roughly 16–20MB
- Tracking: roughly 0.8–1.2GB
An event record can be highly specific. In one example from the Argentina–France final, Lionel Messi’s header initial touch is recorded at 13:36 in period one, including his position group, team, frame number, game clock, body type, ball height, pressure, pass outcome, and intended receiver, Julián Álvarez.
From tracking data to a watchable game
The planned system consists of an API server for available matches and player information, a streaming endpoint for XY coordinates, and a web viewer with a game selector and video player.
The first version renders matches in 2D. Dickey says Claude helped parse the PFF specification and create a compressed, streamable format. Each game occupies about 100MB, divided into approximately 600 ten-second files that the client requests sequentially during playback. JSON is functional but not especially efficient, leaving room for further optimization.
A 3D version can reuse the same XY coordinates, placing players inside a modeled stadium. But simple position playback fails during corner kicks, headers, injuries, and other moments when players are not simply running. Broadcast tracking is also unavailable for an average of 27% of airtime, when the ball is out of play or the camera shows a replay, close-up, or another non-field view.
To fill those gaps, the viewer triggers scripted motions and cutscenes from event data. Examples include headers, goalkeeper dives, goal celebrations, injuries, set-piece camera angles, cards, offsides, VAR reviews, and substitutions. A goal celebration averages 2.7 per game and lasts 20 seconds; throw-ins average 40.9 per game and receive six-second camera sequences.
A simulated crowd adds fans in home and away jerseys, with visible and audible reactions when a team advances or shoots. The result is a reasonably faithful recreation of a match rather than a broadcast replacement.
Because the playback is driven by structured match data, the same system can render the game in radically different settings—including aliens playing the 2022 World Cup final on Mars. Dickey has open-sourced the data builder and viewer for others to fork and extend.

Computing Editor
Tomas lives in the terminal. He covers chips, laptops, and operating systems with a focus on performance and efficiency. He reads kernel changelogs the way other people read fiction, and he's always on the hunt for the perfect mechanical keyboard switch. If it processes data, Tomas has an opinion on it.
via Hacker News