Bitcoin’s price has been caught in a tight range near $70,000, sparking debate over whether the cryptocurrency is stabilizing or setting up for another decline. Recent technical analysis points to a recurring ”distribution” phase-a pattern historically followed by significant price drops. Despite attempts to break higher in early March, Bitcoin has struggled to hold gains above $76,000, hinting at a possible break below $50,000.
A crypto analyst known as Ardi described Bitcoin’s price movements as repeating a familiar distribution mechanism. The process starts with price consolidating within a range, luring traders into a false sense of security. Optimism builds during brief breakouts above local resistance, but when these fail to hold, the price often collapses back below support levels.
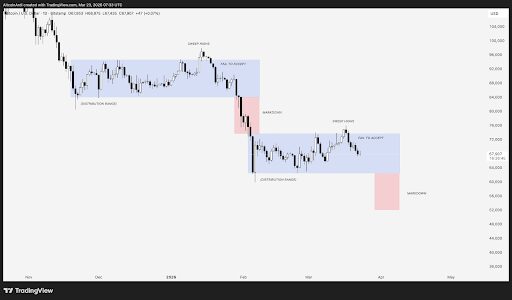
Ardi’s analysis compares the current February-to-March price range between $63,000 and $72,000 with a very similar distribution pattern observed between November 2025 and January 2026, when Bitcoin moved between about $85,000 and $92,000. Both consolidation phases ended with failed breakouts near $96,000 and a sharp drop toward $63,000, suggesting we could be witnessing history repeating itself.
The recent failed attempt to reclaim highs above $76,000 has been followed by bearish candles, pushing Bitcoin toward the lower edge of its current trading band again. Chart projections based on previous markdowns forecast a potential slide down to the $48,000-$50,000 zone. This finding aligns with several other experts who also foresee Bitcoin breaking below $50,000 before finding a more durable bottom.
While a sustained rally above recent highs would invalidate this bearish narrative, the failure to maintain momentum so far suggests caution. Bitcoin’s repeated distribution phases underscore how technical patterns can offer valuable, if gloomy, insights into potential price trajectories. Traders betting on recovery might want to keep a close eye on support levels near $63,000 and the psychological barrier at $50,000.