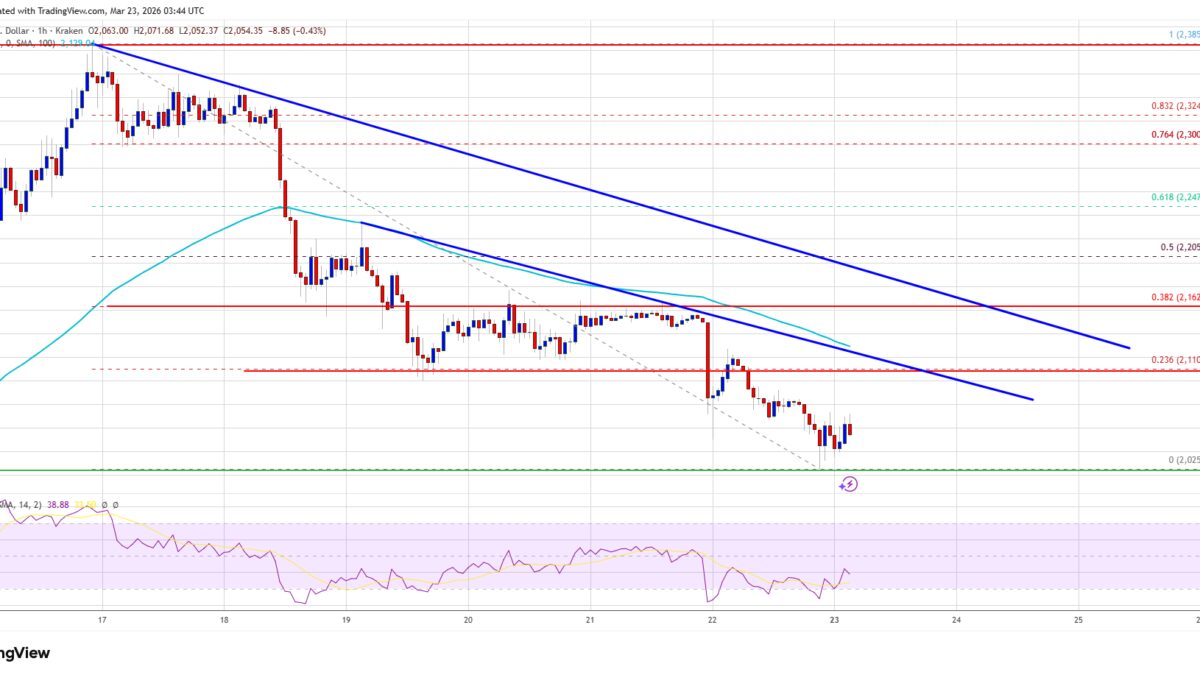
Ethereum’s price has slipped sharply below the $2,100 mark, crowding near a critical support level at $2,025 as bearish momentum picks up. After failing to sustain itself above $2,220, the cryptocurrency fell through $2,120 and currently trades under its 100-hour Simple Moving Average (SMA), signaling near-term weakness according to hourly charts sourced from Kraken. Two descending resistance lines around $2,120 and $2,165 continue to cap any attempts at recovery.
The downward pressure follows a breakdown below $2,150 and accelerated past $2,120, leading Ethereum briefly under $2,050 before stabilizing around the $2,020 zone. The price currently consolidates below the 23.6% Fibonacci retracement of its prior drop from a $2,385 peak, underscoring cautiousness among traders. Momentum indicators are aligning with this bearish tone: the MACD shows growing downside strength, and the RSI is trading below 50.
On the upside, bulls face immediate barriers near $2,080 and then at the $2,120 SMA zone; breaking through these could invite a retest of $2,165 resistance and potentially a move back towards the $2,200 to $2,300 range, the latter aligning with a mid-level Fibonacci retracement.
However, failure to penetrate the $2,120 ceiling may exacerbate declines, with sellers targeting the $2,040 support and the psychologically important $2,025 level. Losing that ground risks pushing Ethereum towards the $2,000 mark-and possibly down to $1,965. The next stronghold lies near $1,880, a level that previously acted as a floor for ETH price correction.
This price action parallels broader market weakness similar to Bitcoin’s struggles over recent sessions, highlighting systemic selling pressure across major cryptocurrencies. Ethereum’s challenge is to break these technical thresholds to halt its slide or risk entering a deeper negative phase before recovery attempts.
With macroeconomic factors like fluctuating investor sentiment and evolving regulatory news still in play, Ethereum’s near-term trajectory remains uncertain. Traders eyeing this volatile phase should consider the outlined resistance and support levels as key markers for possible entry or exit points.
Ethereum price technical analysis and support levels
- Current price below $2,100, near key support at $2,025
- Resistance levels at $2,080, $2,120 (SMA), and $2,165
- Potential downside targets: $2,040, $2,000, $1,965, and strong support near $1,880
- Indicators: MACD showing downside strength, RSI below 50
- Price consolidation below 23.6% Fibonacci retracement from $2,385 peak
Market factors affecting Ethereum price movement
Ethereum’s price movements are influenced by broader cryptocurrency market trends, including Bitcoin’s recent weakness. Additionally, macroeconomic elements such as investor sentiment fluctuations and regulatory developments are impacting ETH’s price direction. Traders should closely monitor these factors alongside technical levels for informed decision-making.