Traders hate uncertainty. So when Bitcoin prints a fifth straight red monthly candle, the impulse is to look for a bottom and a timetable. That instinct is understandable – but it is also the wrong way to read what’s unfolding.
The immediate story: streak, numbers, and the optimism whisper
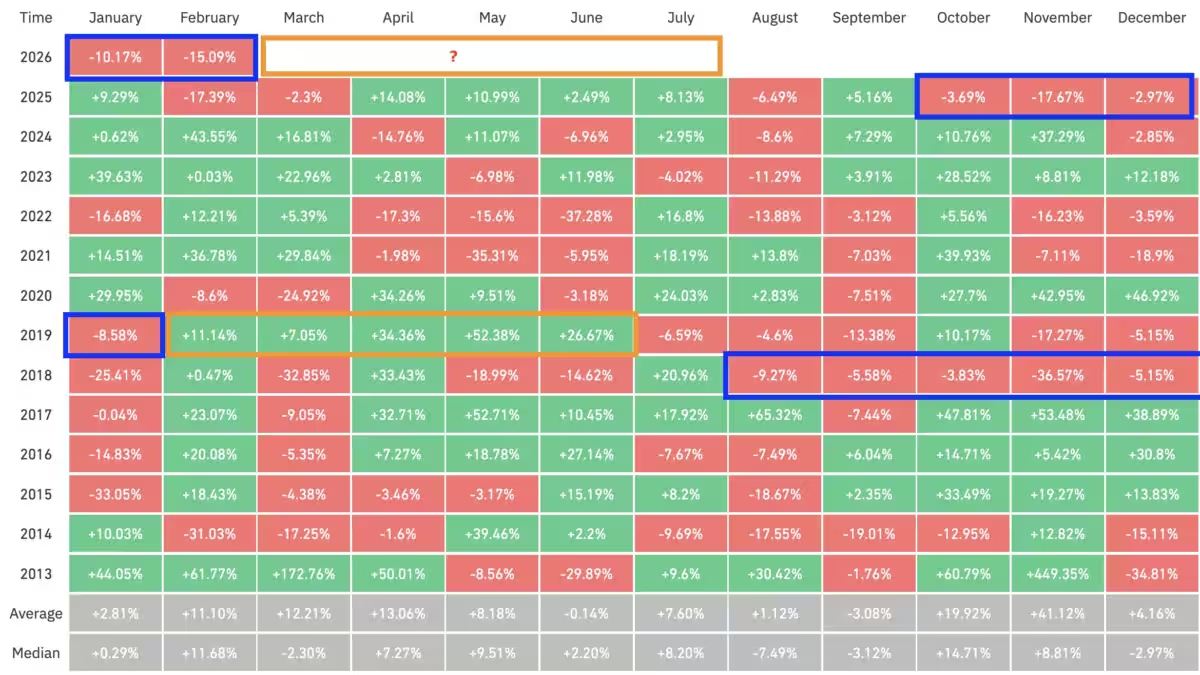
Bitcoin is on track for a fifth consecutive losing monthly candle, reportedly down 15% this month after closing the previous four months in the red. Headlines show stark streaks; analysts and chart-watchers point to history and ask: when does the rebound begin?
There is precedent for dramatic turnarounds. One dataset shows that after a similar multi-month slide in 2018/19, Bitcoin rallied roughly 316% over the following five months. That kind of snapback is the narrative many retail traders cling to – and it fuels the seasonal hope that March or April could bring a swift recovery.
Why the historical comparison is useful – and misleading
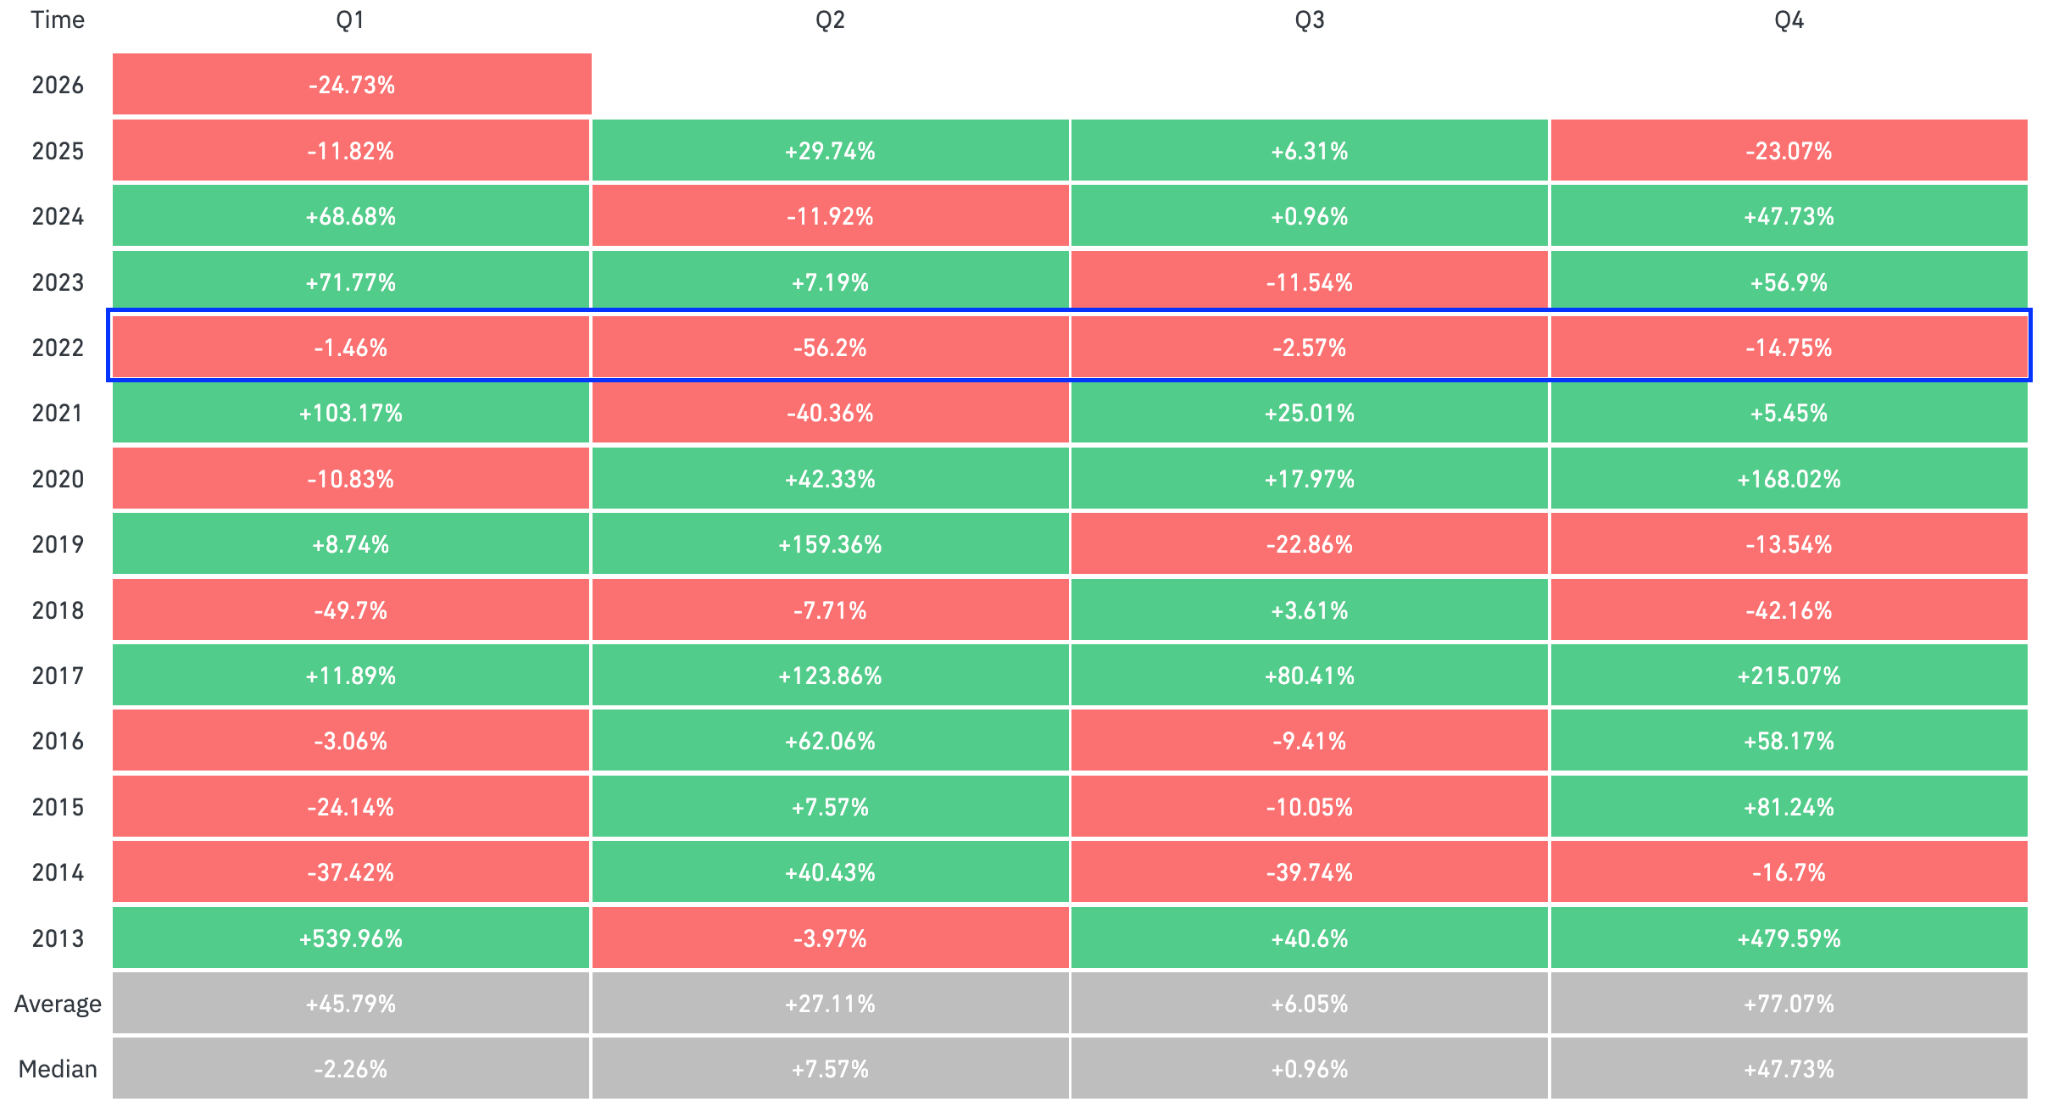
History provides a menu of outcomes, not a recipe. Several prior selloffs ended with sharp recoveries, but the 2022 cycle is a useful counterexample: that year saw four consecutive losing quarters and a cumulative drop of 64%, with Bitcoin finishing the year at $16,500 after opening at $46,230. Parallel-looking streaks can lead to very different endings.
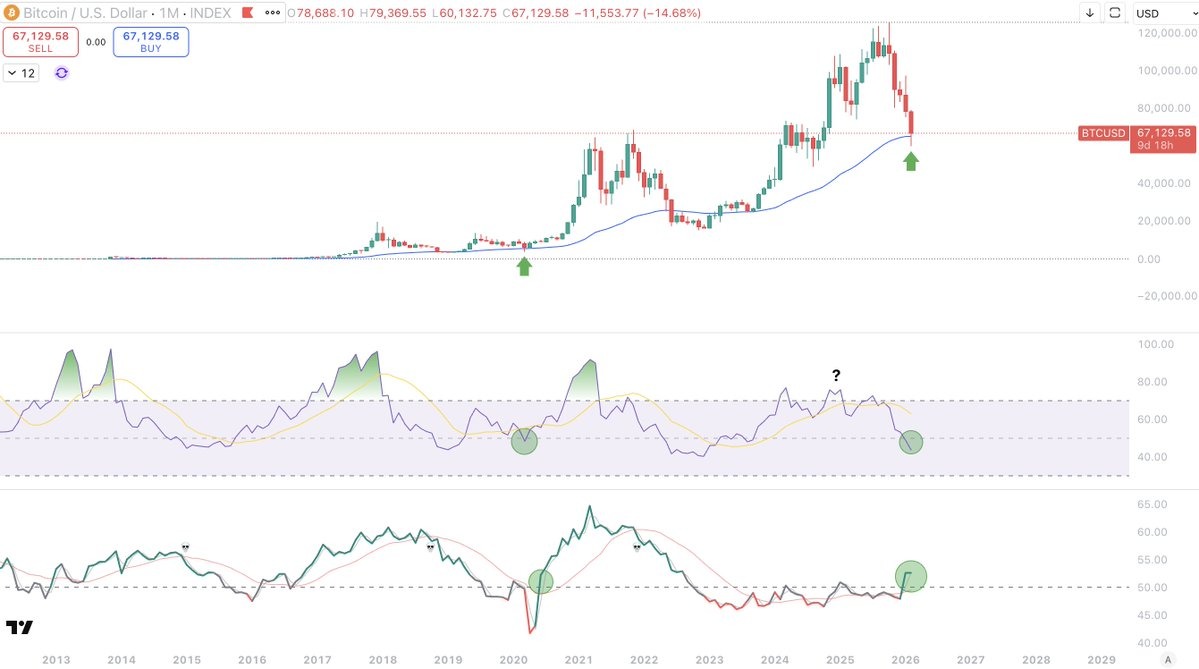
On shorter timeframes the picture is noisy, too. Weekly momentum recently printed a multi-week losing run – the second-longest on record – and some of the longest weekly streaks in 2022 preceded the slide from roughly $46,800 to $20,500. Those stretches show that a string of red periods is neither necessary nor sufficient to mark a bottom.
This cycle is not 2018 redux – market structure has changed
What makes the present different is not a single chart pattern but structural shifts since 2018. The launch of U.S. spot Bitcoin ETFs in early 2024 rerouted large amounts of capital into regulated custody channels. The April 2024 halving reduced miner revenue per coin and altered expected supply schedules. And over the last few years institutional custody and self-custody growth have taken meaningful balances off exchanges – removing, in theory, some immediate sell pressure.
At the same time, macro conditions that drove risk assets higher in past cycles are more ambiguous today. Central bank policy, rate expectations and global liquidity remain central determinants of whether capital chases a rebound or flees to cash.
Who wins, who loses
Momentum traders and leveraged longs lose when streaks extend; forced liquidations compound moves. Short sellers and options sellers can profit from extended weakness – provided they manage carry costs and volatility. Long-term holders and institutions with custody arrangements benefit from lower exchange inventories and can use drawdowns to accumulate.
What to watch next – scenarios, triggers, and a reality check
There are a few realistic scenarios traders should prepare for.
1) A quick rebound: If macro liquidity improves and ETF flows resume, the market could trace a sharp V-type recovery – the kind historical multi-month selloffs sometimes produce. That’s the optimistic read many point to when citing the 2018/19 rebound.
2) A prolonged correction: If macro weakness persists or miners and long holders supply the market, losses could stretch longer – echoing 2022’s multi-quarter decline. Momentum indicators that already reached previous bear lows argue this is possible.
3) Choppy grind: Expect a messy mix of range trading, short squeezes and periodic volatility spikes. Structural changes mean rebounds may not follow previous cadence; price action could be driven more by flows (ETFs, derivatives) than by retail FOMO.
Practical signals worth watching
Look at flows and on-chain signals rather than counting red months alone. Key items that will matter in the coming weeks:
– ETF inflows and product rebalancing activity. Big, sustained inflows can mop up available supply and support a rally.
– Exchange supply trends. Falling exchange balances have been a multi-year tailwind; a reversal would be a worry.
– Macro catalysts: rate decisions, bank stress, or surprise liquidity shifts will amplify either direction.
– Miner behaviour. If miners increase selling to cover costs, that can keep pressure on price even as other buyers accumulate.
Verdict
A fifth red month is a headline, not a verdict. It narrows the set of possibilities, but it doesn’t name the winner. The market today has different plumbing – ETFs, changed custody patterns and a post-halving supply profile -so historical streaks are a reference, not a rulebook. Traders should trade the flows and the macro, not the calendar.
This article does not contain investment advice or recommendations. Every investment and trading move involves risk, and readers should conduct their own research when making a decision.